La Vague 49
By Géry Van Vyncht and Arnaud Delobel
Due to their mode of production, monoclonal antibodies are complex and heterogeneous molecules. When changes are made to the manufacturing process of a therapeutic monoclonal antibody, an extensive comparability study has to be performed to comply with the requirements of ICH Q5E guidance[1]. These studies usually require the use of many orthogonal analytical techniques in order to fully characterise the different variants.
In this article, the use of mass spectrometry as a powerful tool for comparability studies is presented, with applications of the methods to a commercial product: Humira® (Adalimumab).
The simplest way of analysing monoclonal antibodies by mass spectrometry is to measure the molecular mass of the intact protein. This test can provide useful information on the identity of the protein, but also on the main glycosylation profile.
The sample is first desalted online by liquid chromatography with a short reversed-phase column to get rid of non-volatile salts. The electrospray mass spectrum obtained is an envelope composed of the different charge states of the protein. It is deconvoluted to yield a spectrum that is more readily interpretable (see Figure 1).
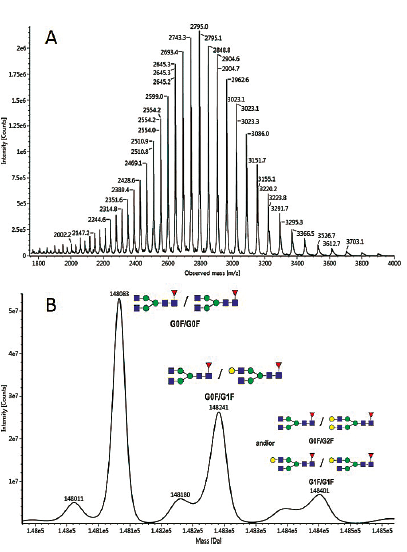
Figure 1: Electrospray mass spectrum (A) and MaxEnt® deconvoluted mass spectrum (B) obtained for intact Adalimumab
On the deconvoluted spectrum, the glycosylation profile can be easily determined. The main glycoforms observed on Adalimumab are G0F/G0F and G0F/G1F. The mass accuracy is usually below 20 ppm.
In order to simplify the spectrum, deglycosylation can be performed. The corresponding mass spectrum is presented in Figure 2. As the spectrum is simplified, other modifications such as C-terminal lysine clipping can be easily observed.
Although intact mass measurement is fast and easy for antibody identification and glycoprofile determination, improved resolution is often valuable, both in terms of chromatographic separation and mass spectrometric determination.
IdeS enzyme is an efficient tool for monoclonal antibody characterisation by mass spectrometry, as the fragments produced have molecular masses of ~ 25 kDa, which allows their analysis by LC/MS with excellent chromatographic resolution and mass accuracy [2].
An example of a chromatogram obtained for Adalimumab after IdeS digestion, with or without further reduction of disulfide bridges, is presented in Figure 3. Molecular masses are measured with a mass accuracy below 1 Da. Thanks to the good chromatographic resolution, variants can also be separated and quantified, such as N-terminal pyroglutamic acid, aglycosylated variants, or oxidised species.
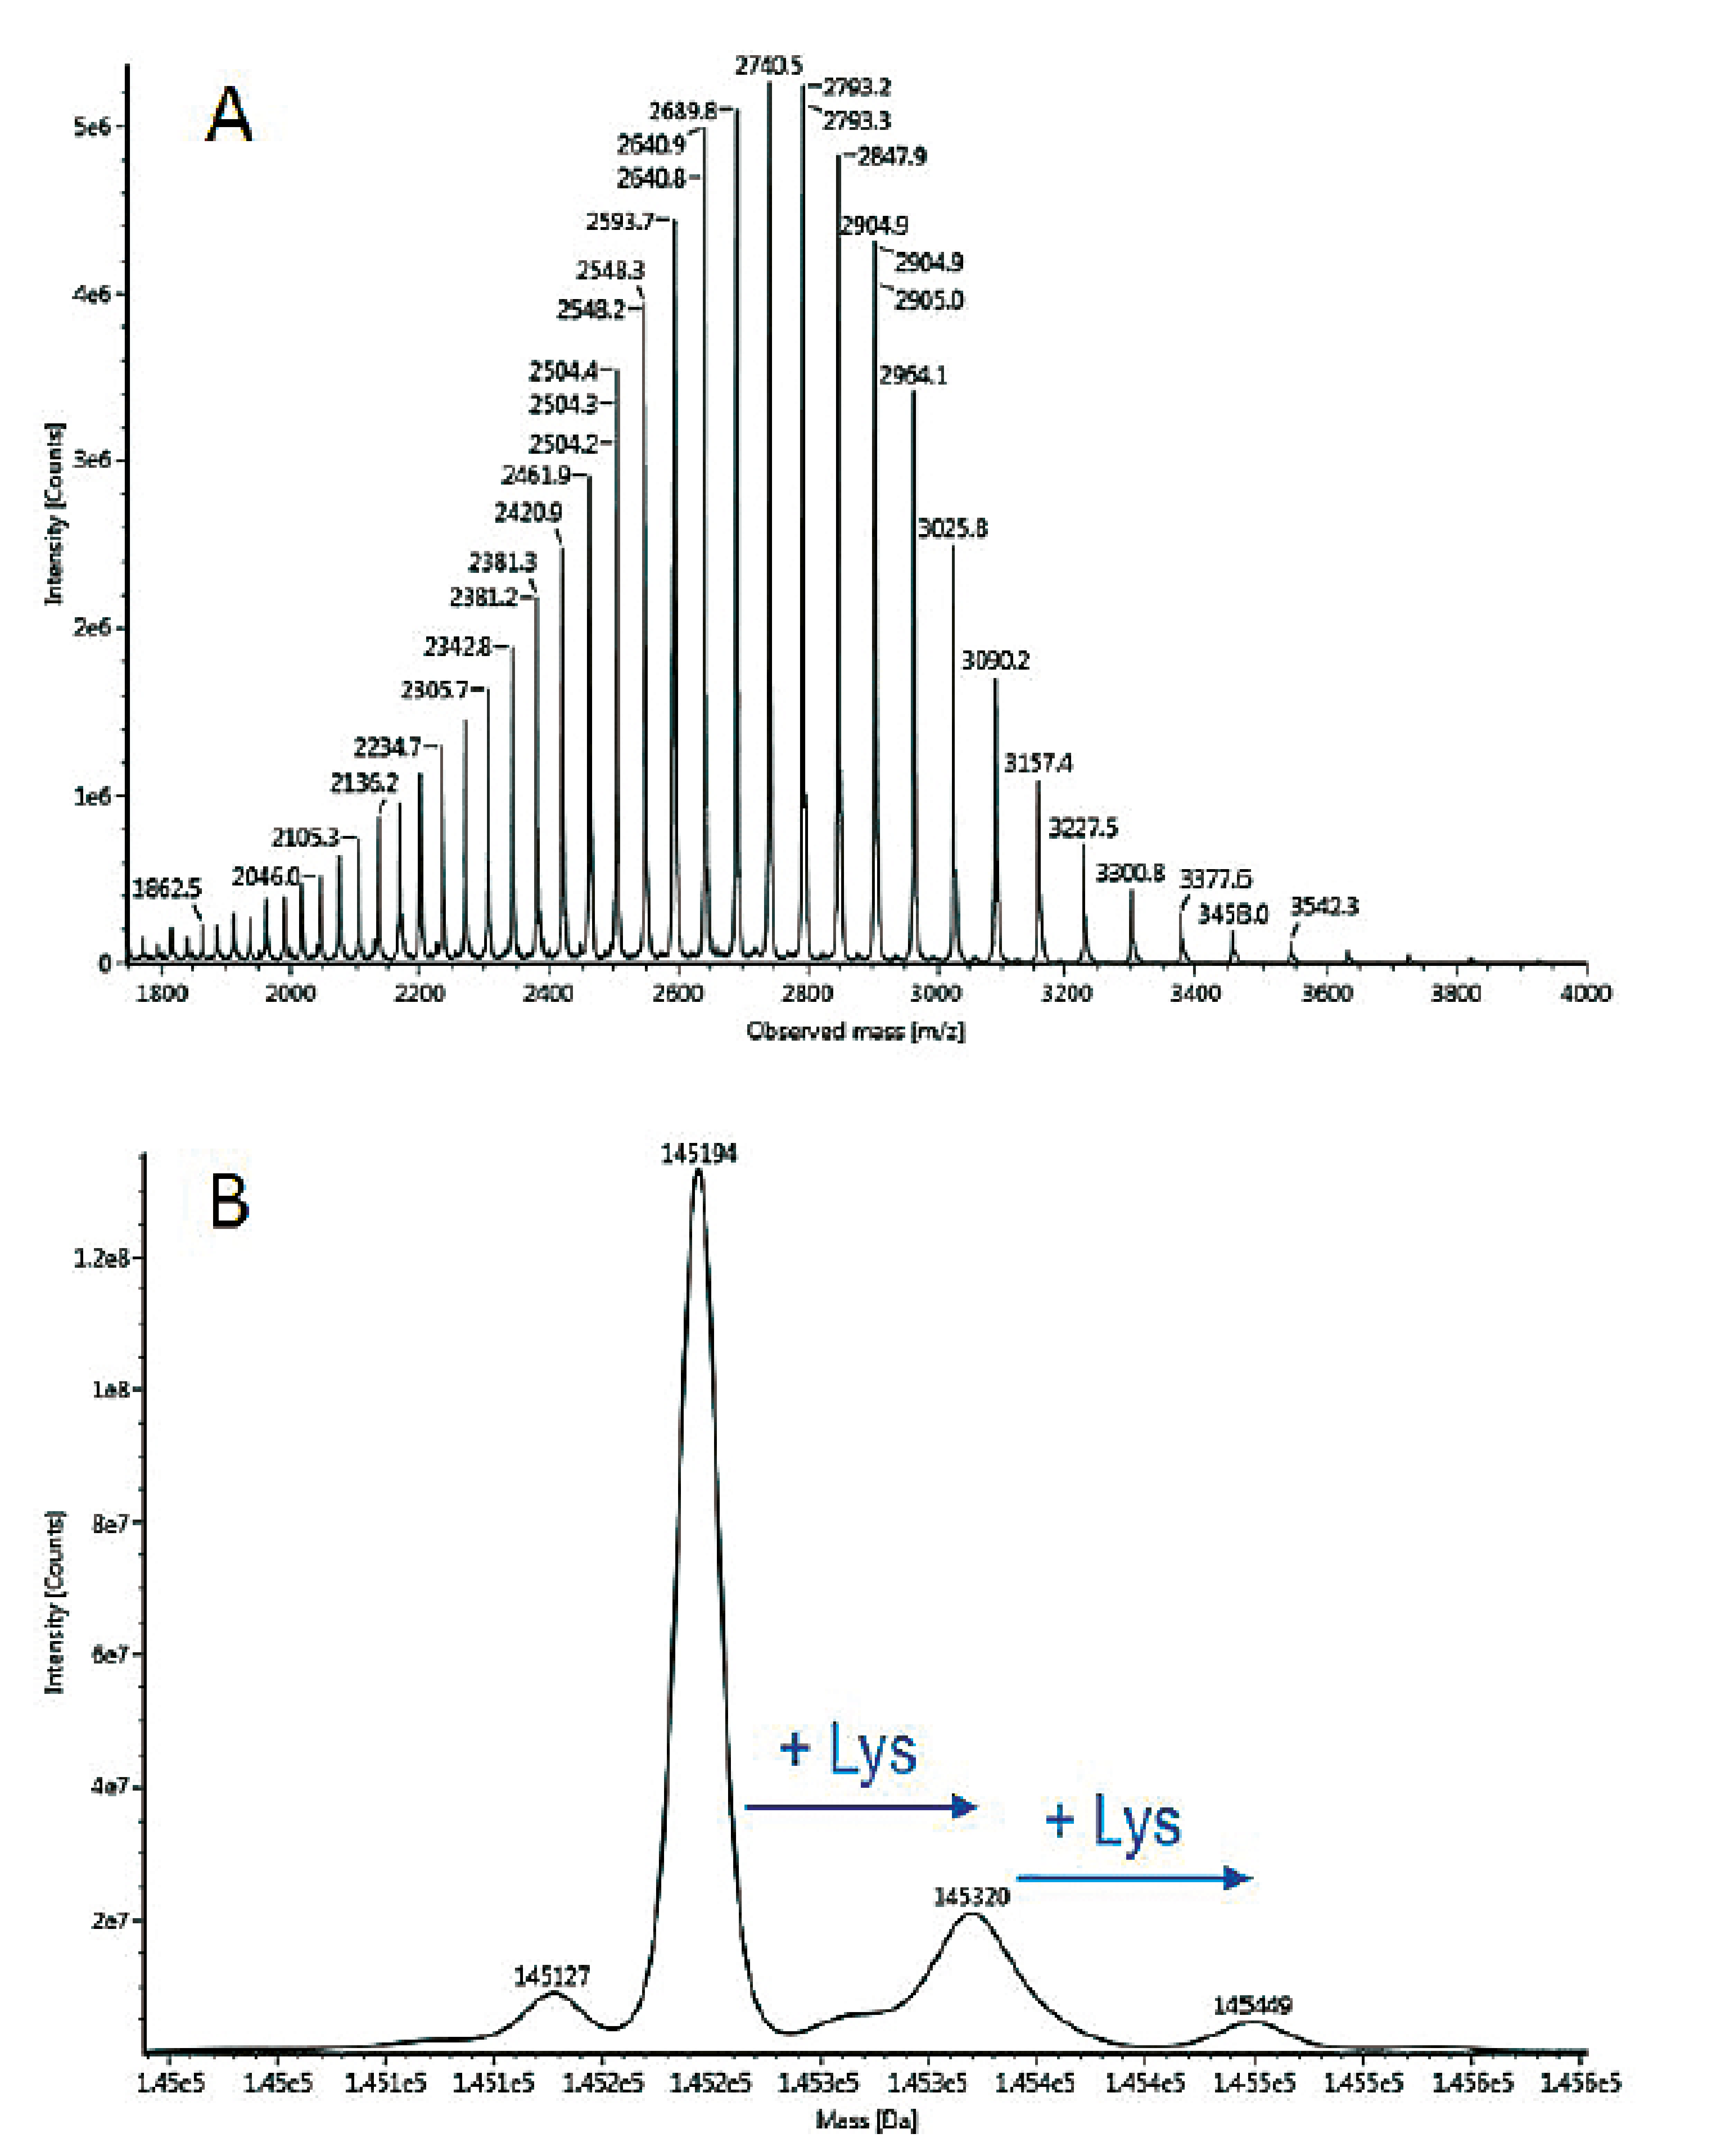
Figure 2: Electrospray mass spectrum (A) and MaxEnt® deconvoluted mass spectrum (B) obtained for N-deglycosylated Adalimumab
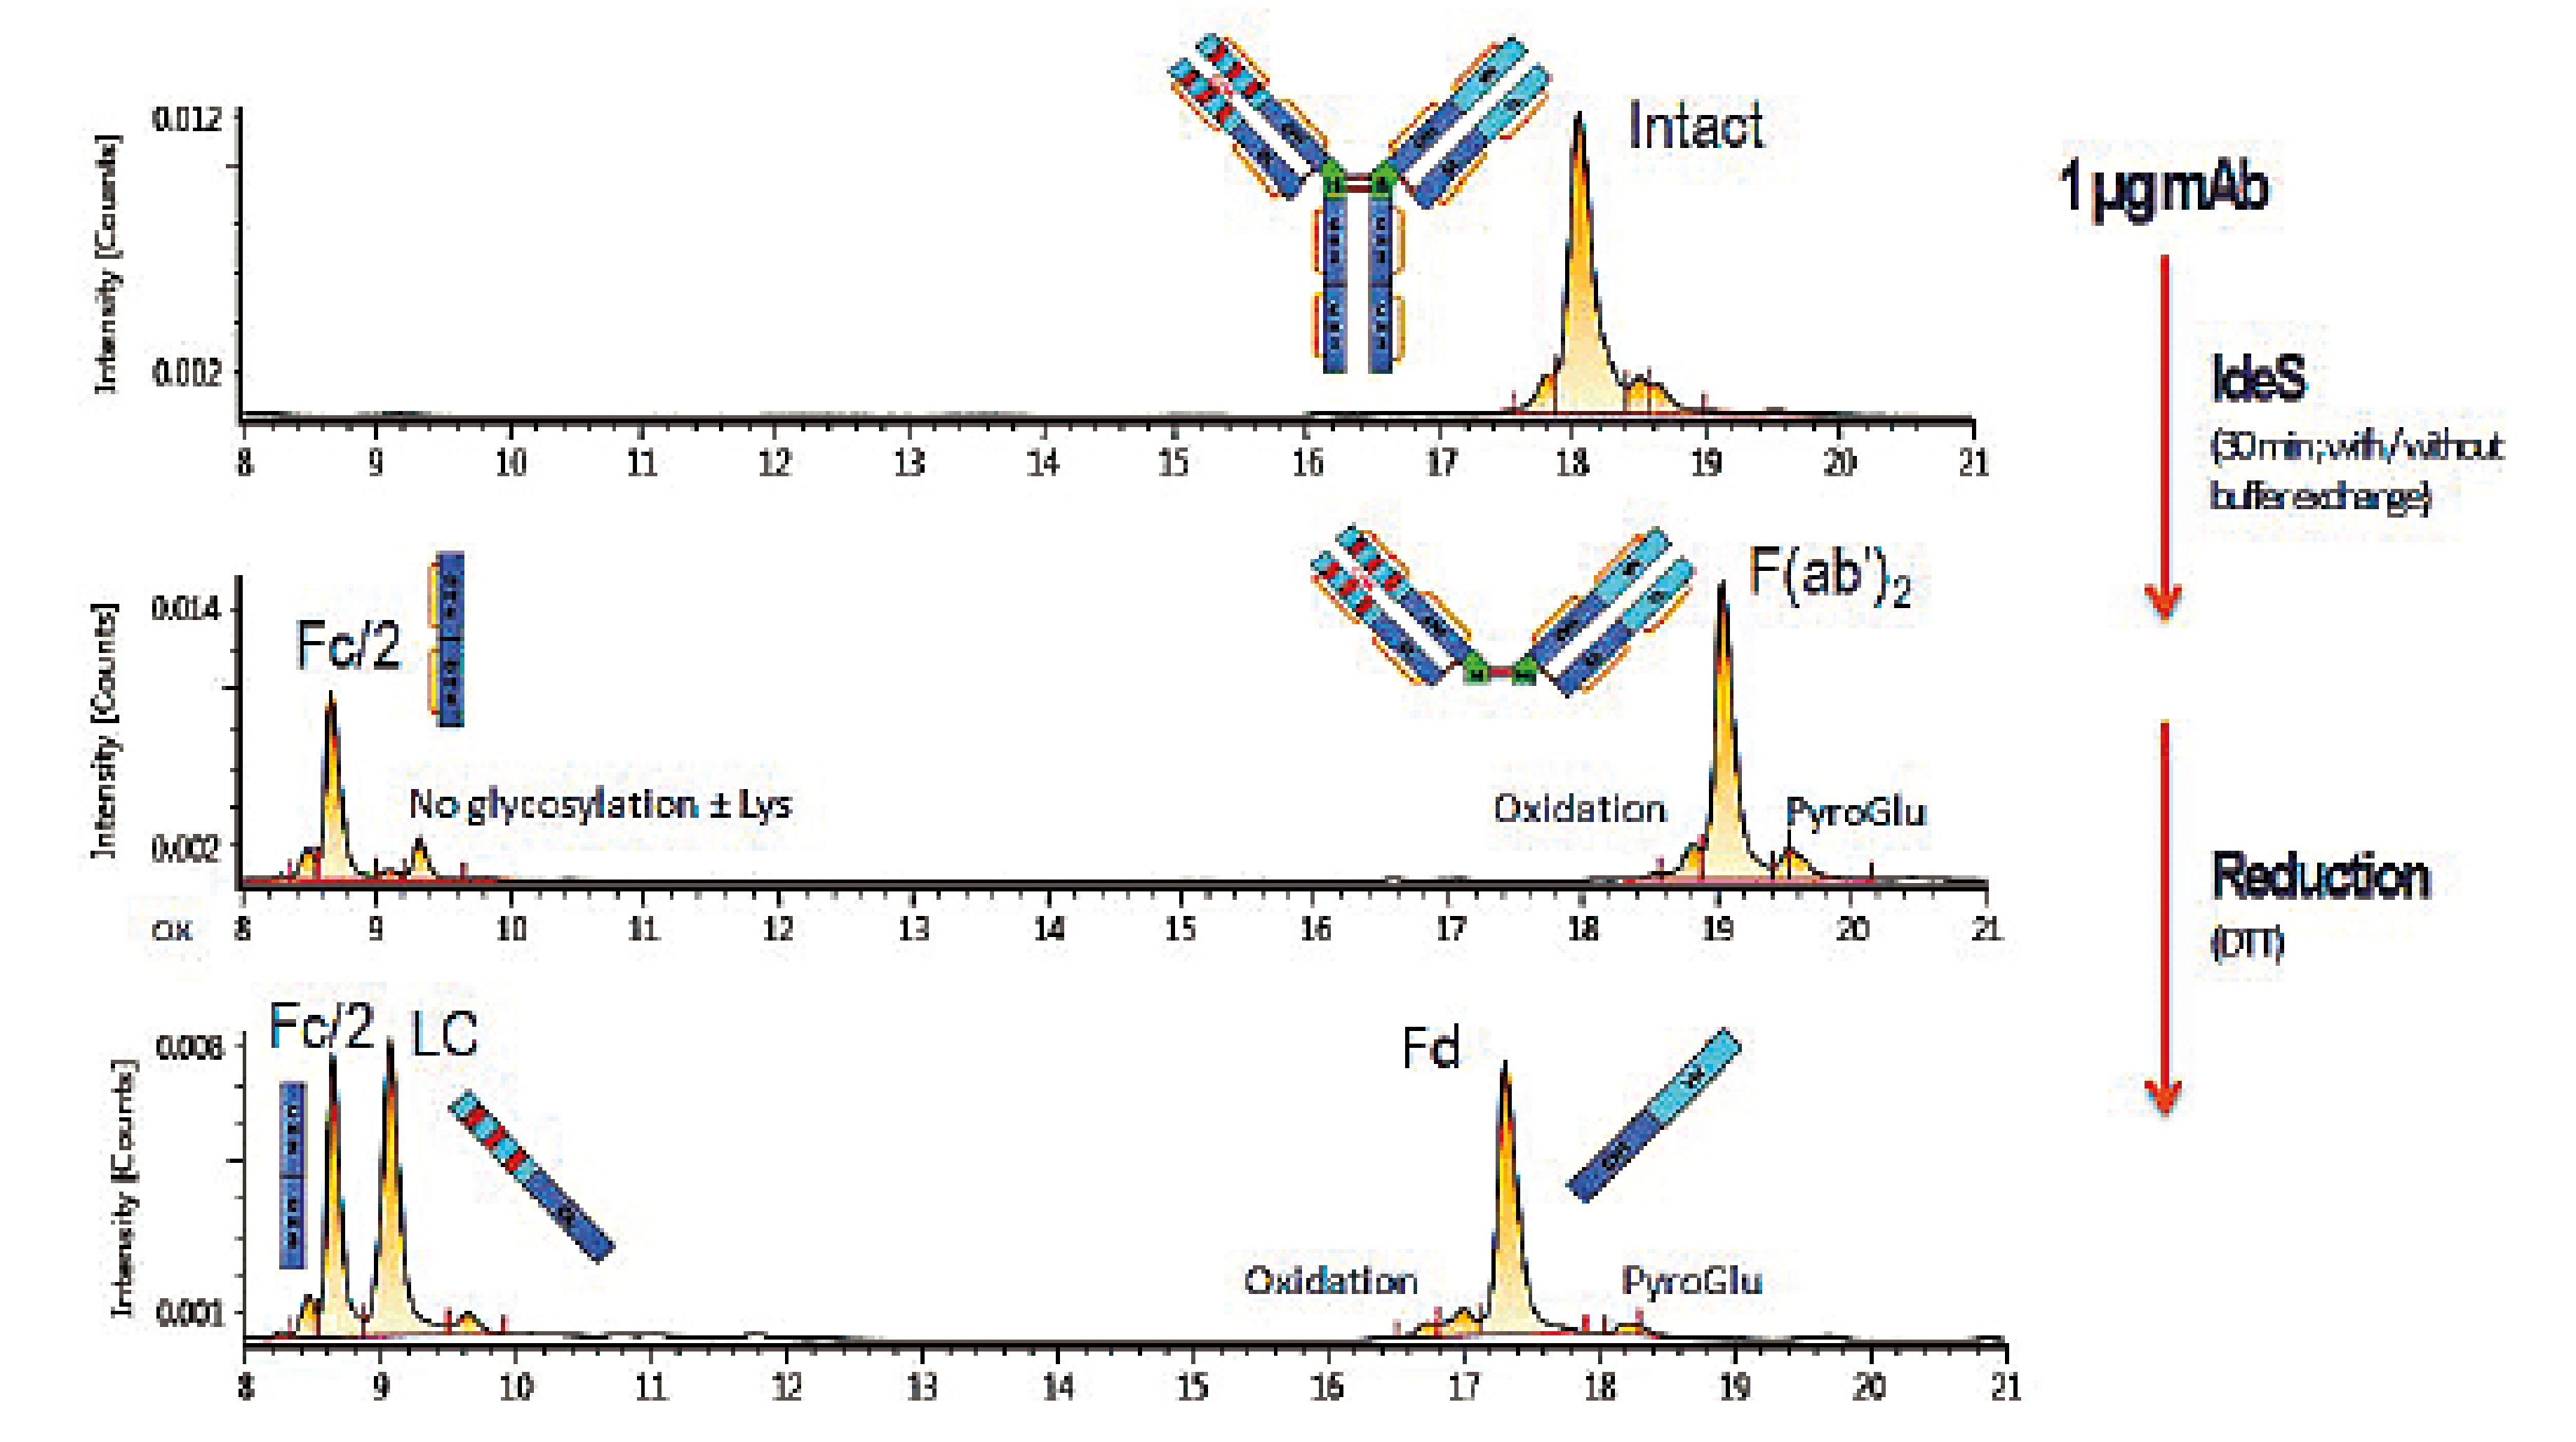
Figure 3: LC/MS analysis of an Adalimumab sample digested with IdeS enzyme then reduced with DTT
The peptide mapping strategy involves the use of a specific protease (e.g. trypsin) to generate small peptides, and the analysis of the resulting peptide mixture by LC with UV and/or MS detections. Advances in both liquid chromatography, mass spectrometry and software now allow the routine analysis of monoclonal antibodies by a peptide mapping methodology to yield a sequence coverage close to 100 %, together with the fine characterisation of post-translational modifications (deamidation, oxidation, glycosylation, N-terminal pyroGlu, C-terminal lysine truncation, etc.).
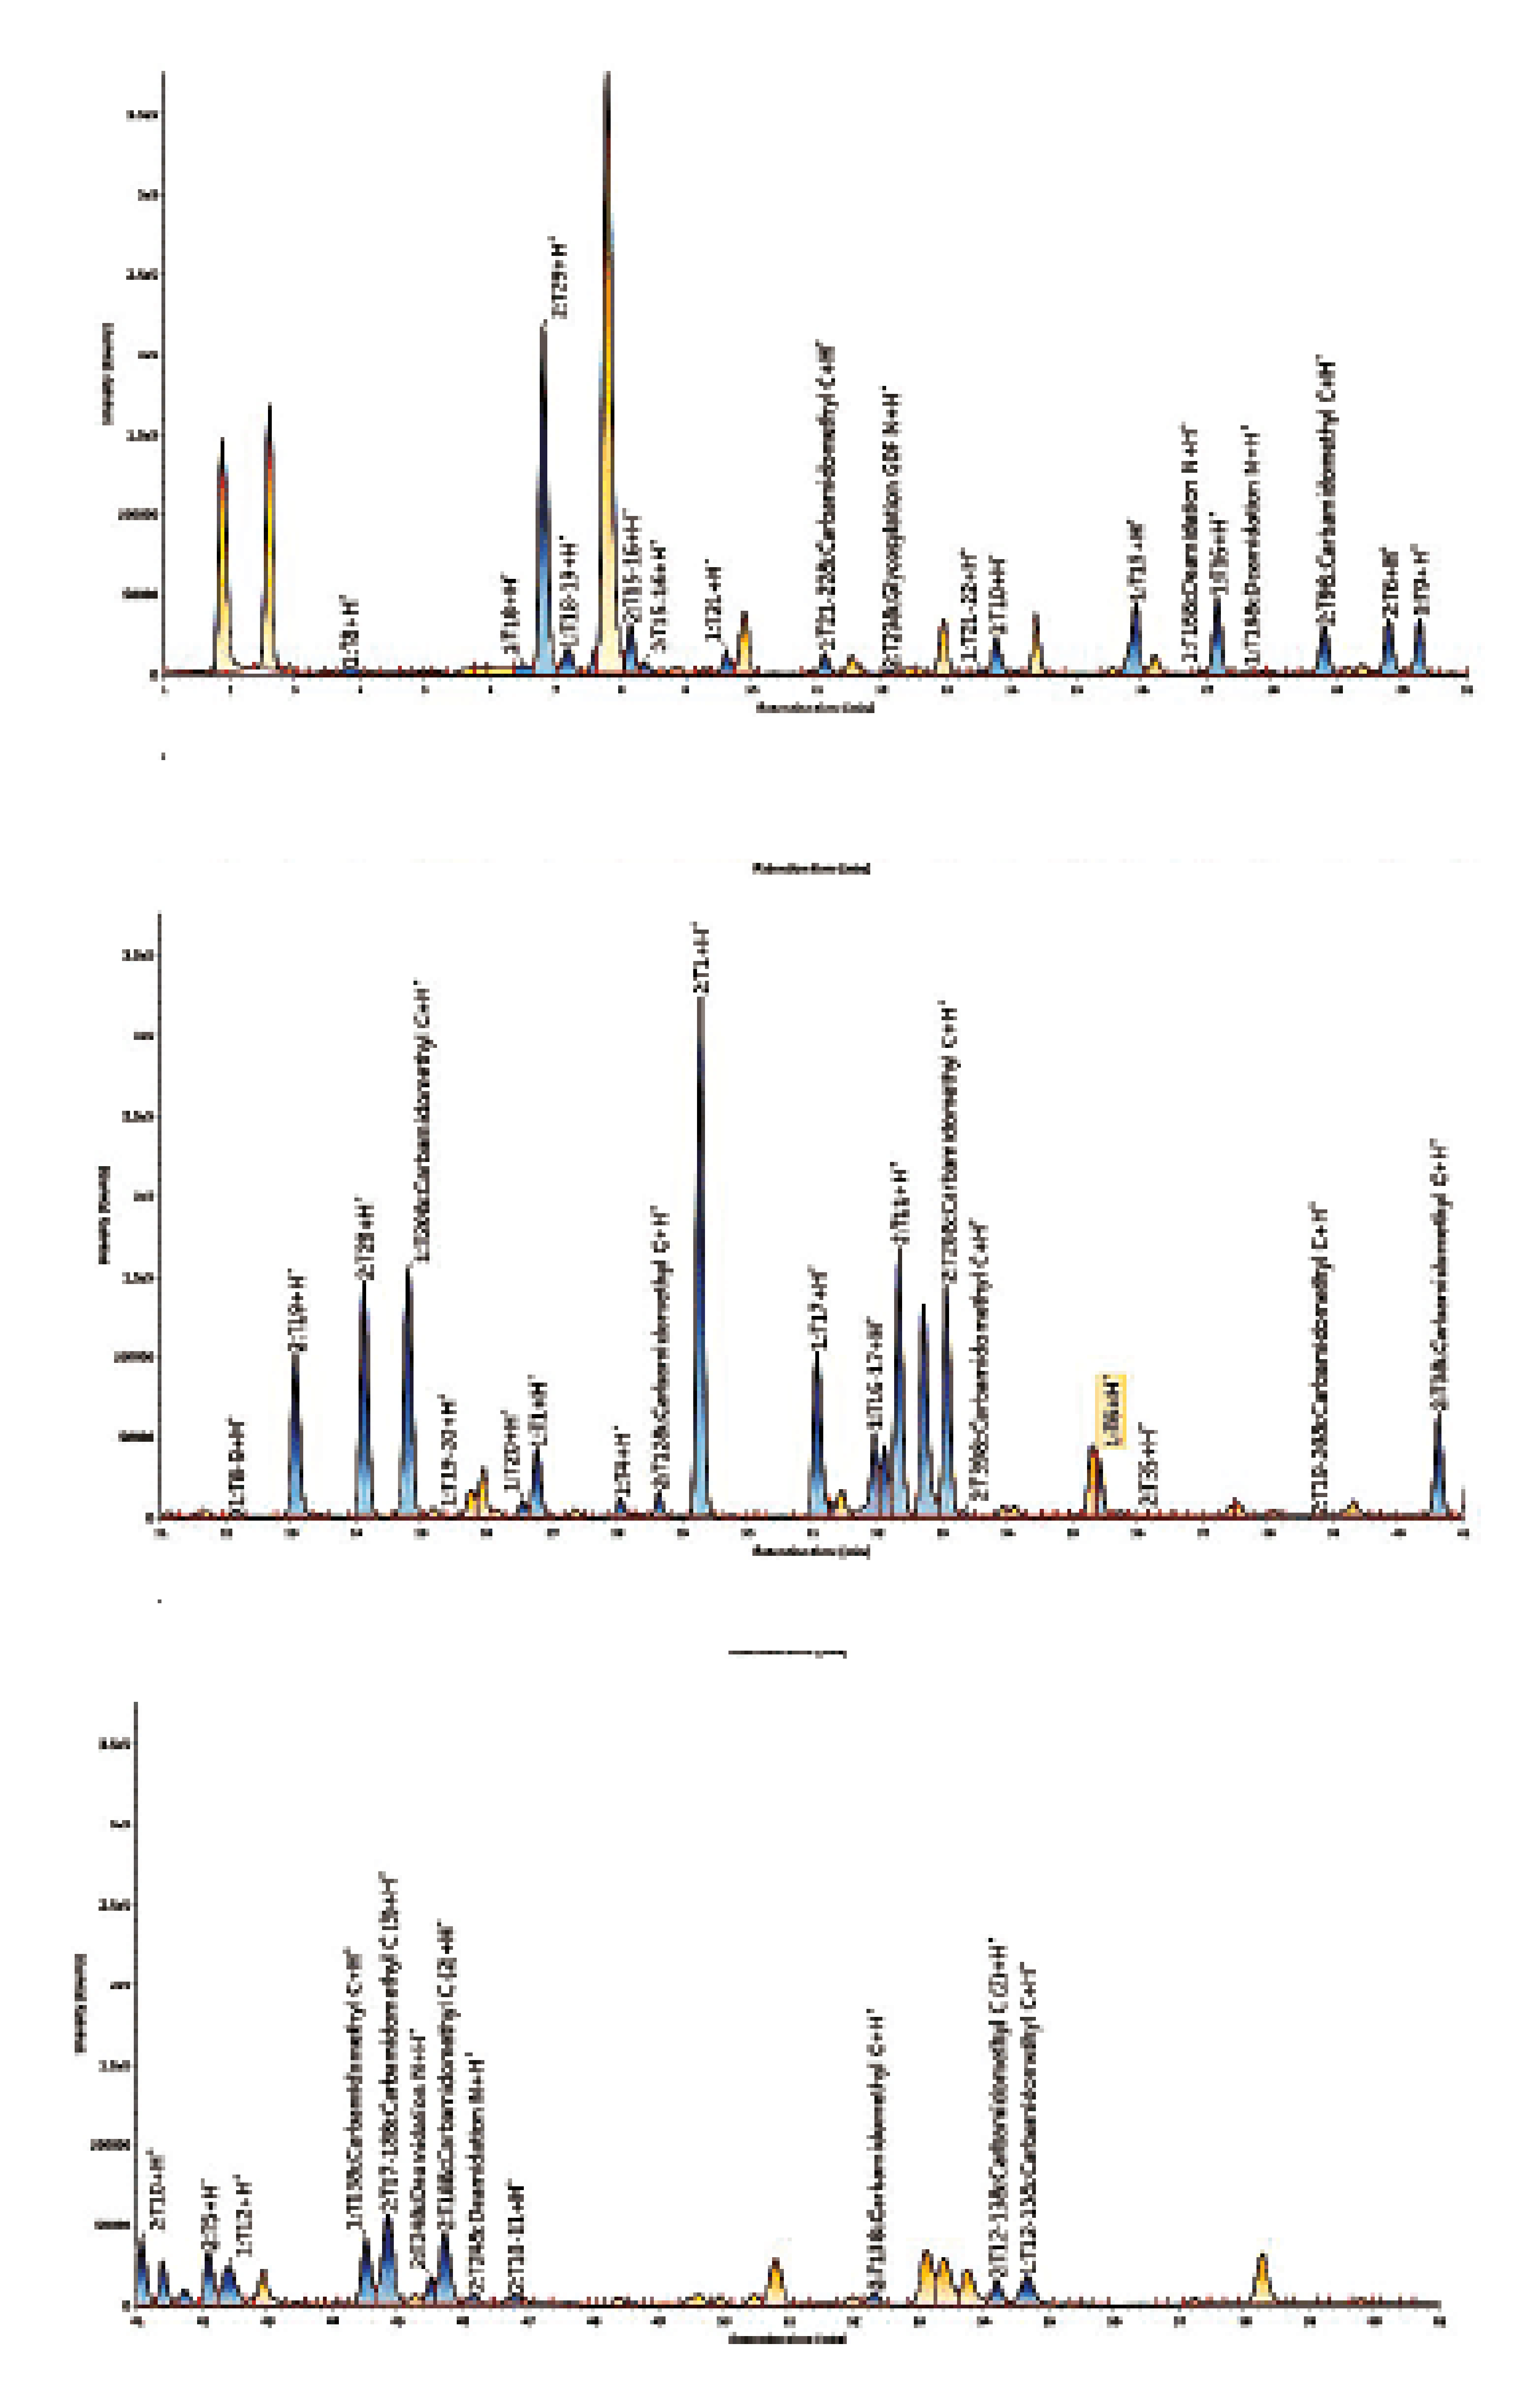
Figure 4: Peptide map of Adalimumab (BPI chromatograms)
The chromatogram obtained for the peptide mapping of Adalimumab is presented in Figure 4. Each peak is identified based on its molecular mass (with a mass tolerance of 5 ppm). The sequence coverage can thus be calculated.
Using this methodology on an Adalimumab sample, we were able to obtain the following results:
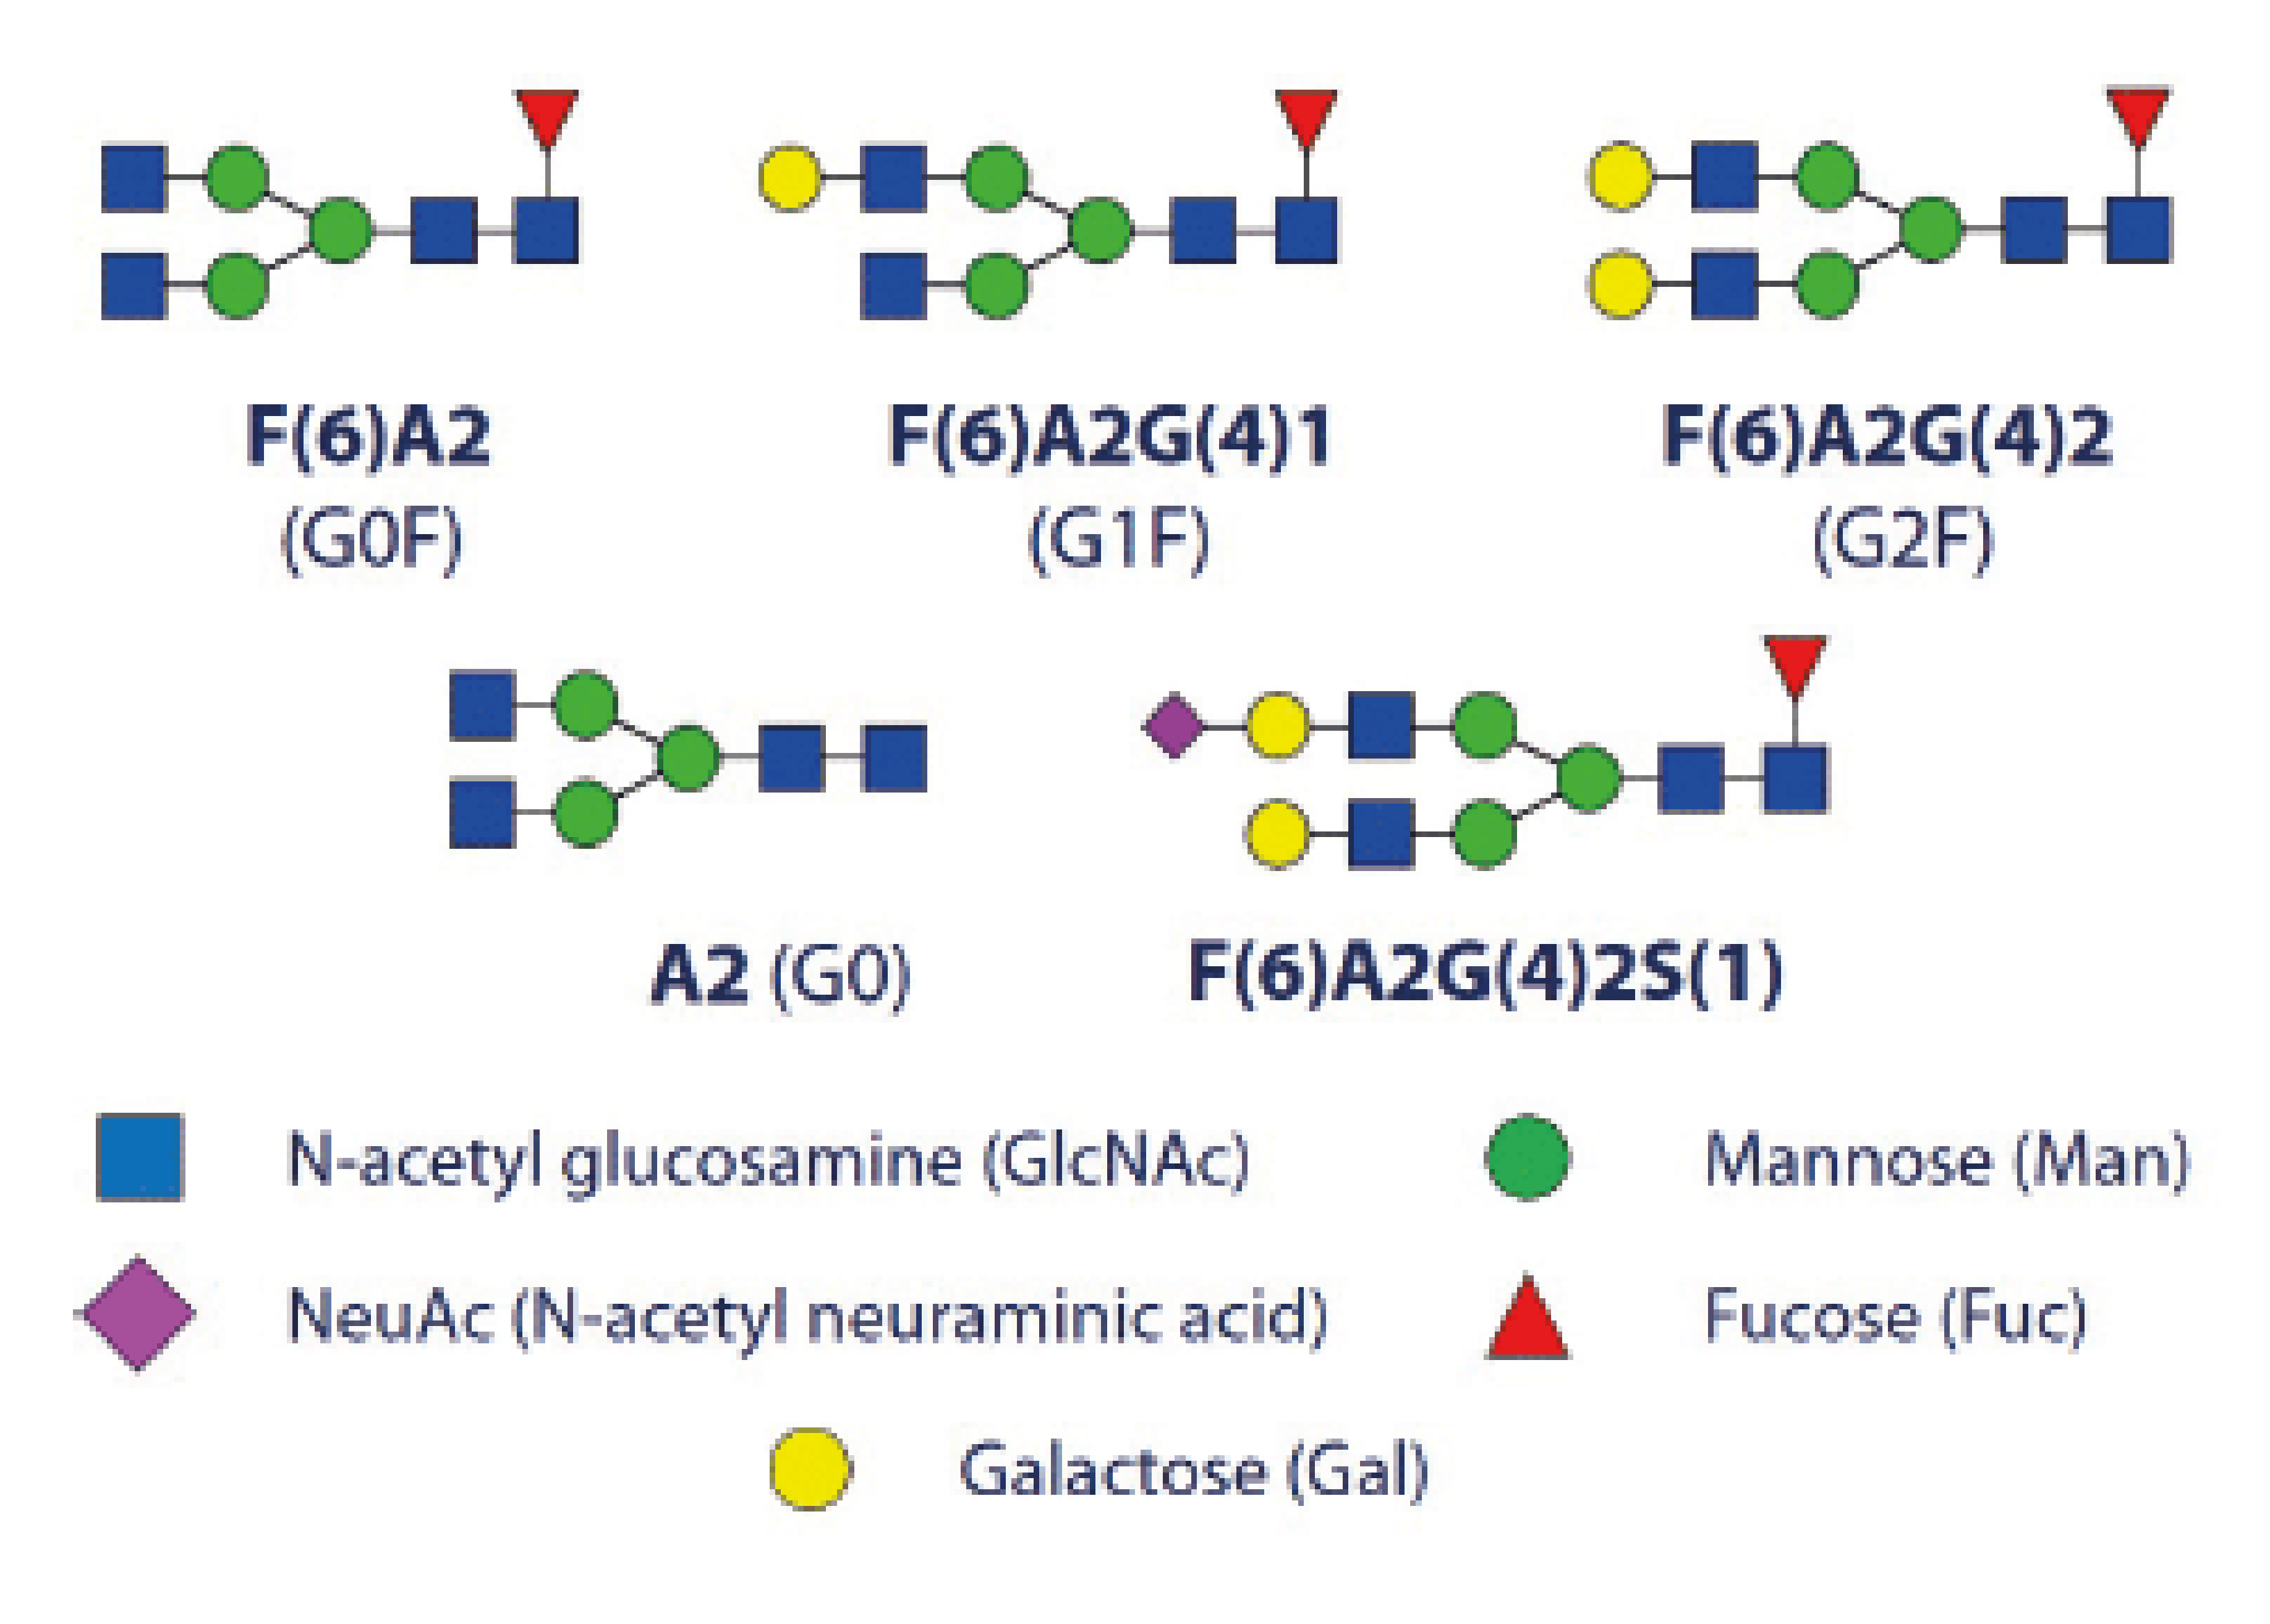
Figure 5: N-glycans commonly found on monoclonal antibodies
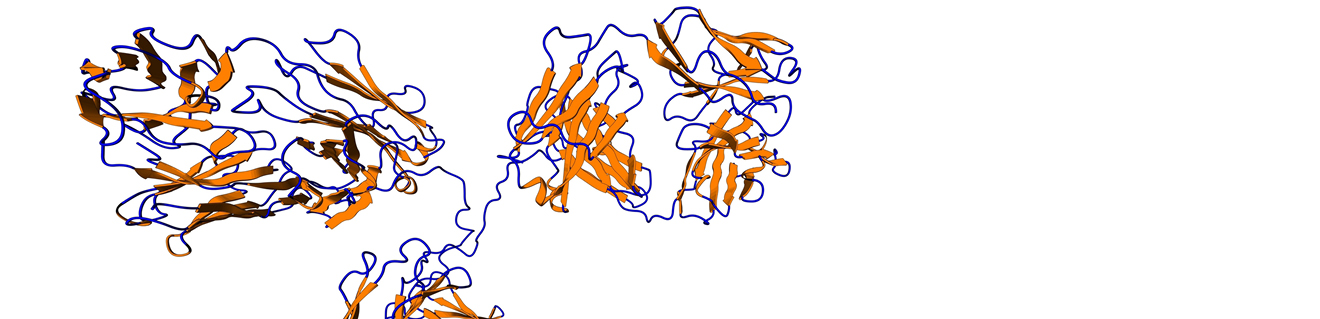
Most therapeutic monoclonal antibodies belong to the IgG class and contain a glycosylation site in the Fc region, located on 297N of the heavy chain (see Figure 5).
Glycosylation is a critical quality attribute [3,4], as the N-glycans profile on the Fc moiety influence the binding to Fc receptors, and therefore modulate the ADCC and ADCP activities. Terminal galactose is also important in the complement-dependent cytotoxicity (CDC). Finally, glycans can also have impacts on the safety of the therapeutic antibody.
UPLC/FLUO of 2-AB labelled N-glycans is a method of choice to characterise the glycosylation of a monoclonal antibody, as well as the batch-to-batch consistency, thanks to its high resolution and reproducibility. With an optimised protocol, the whole procedure including data processing and reporting can be carried out within 24 hours (see Figure 6).
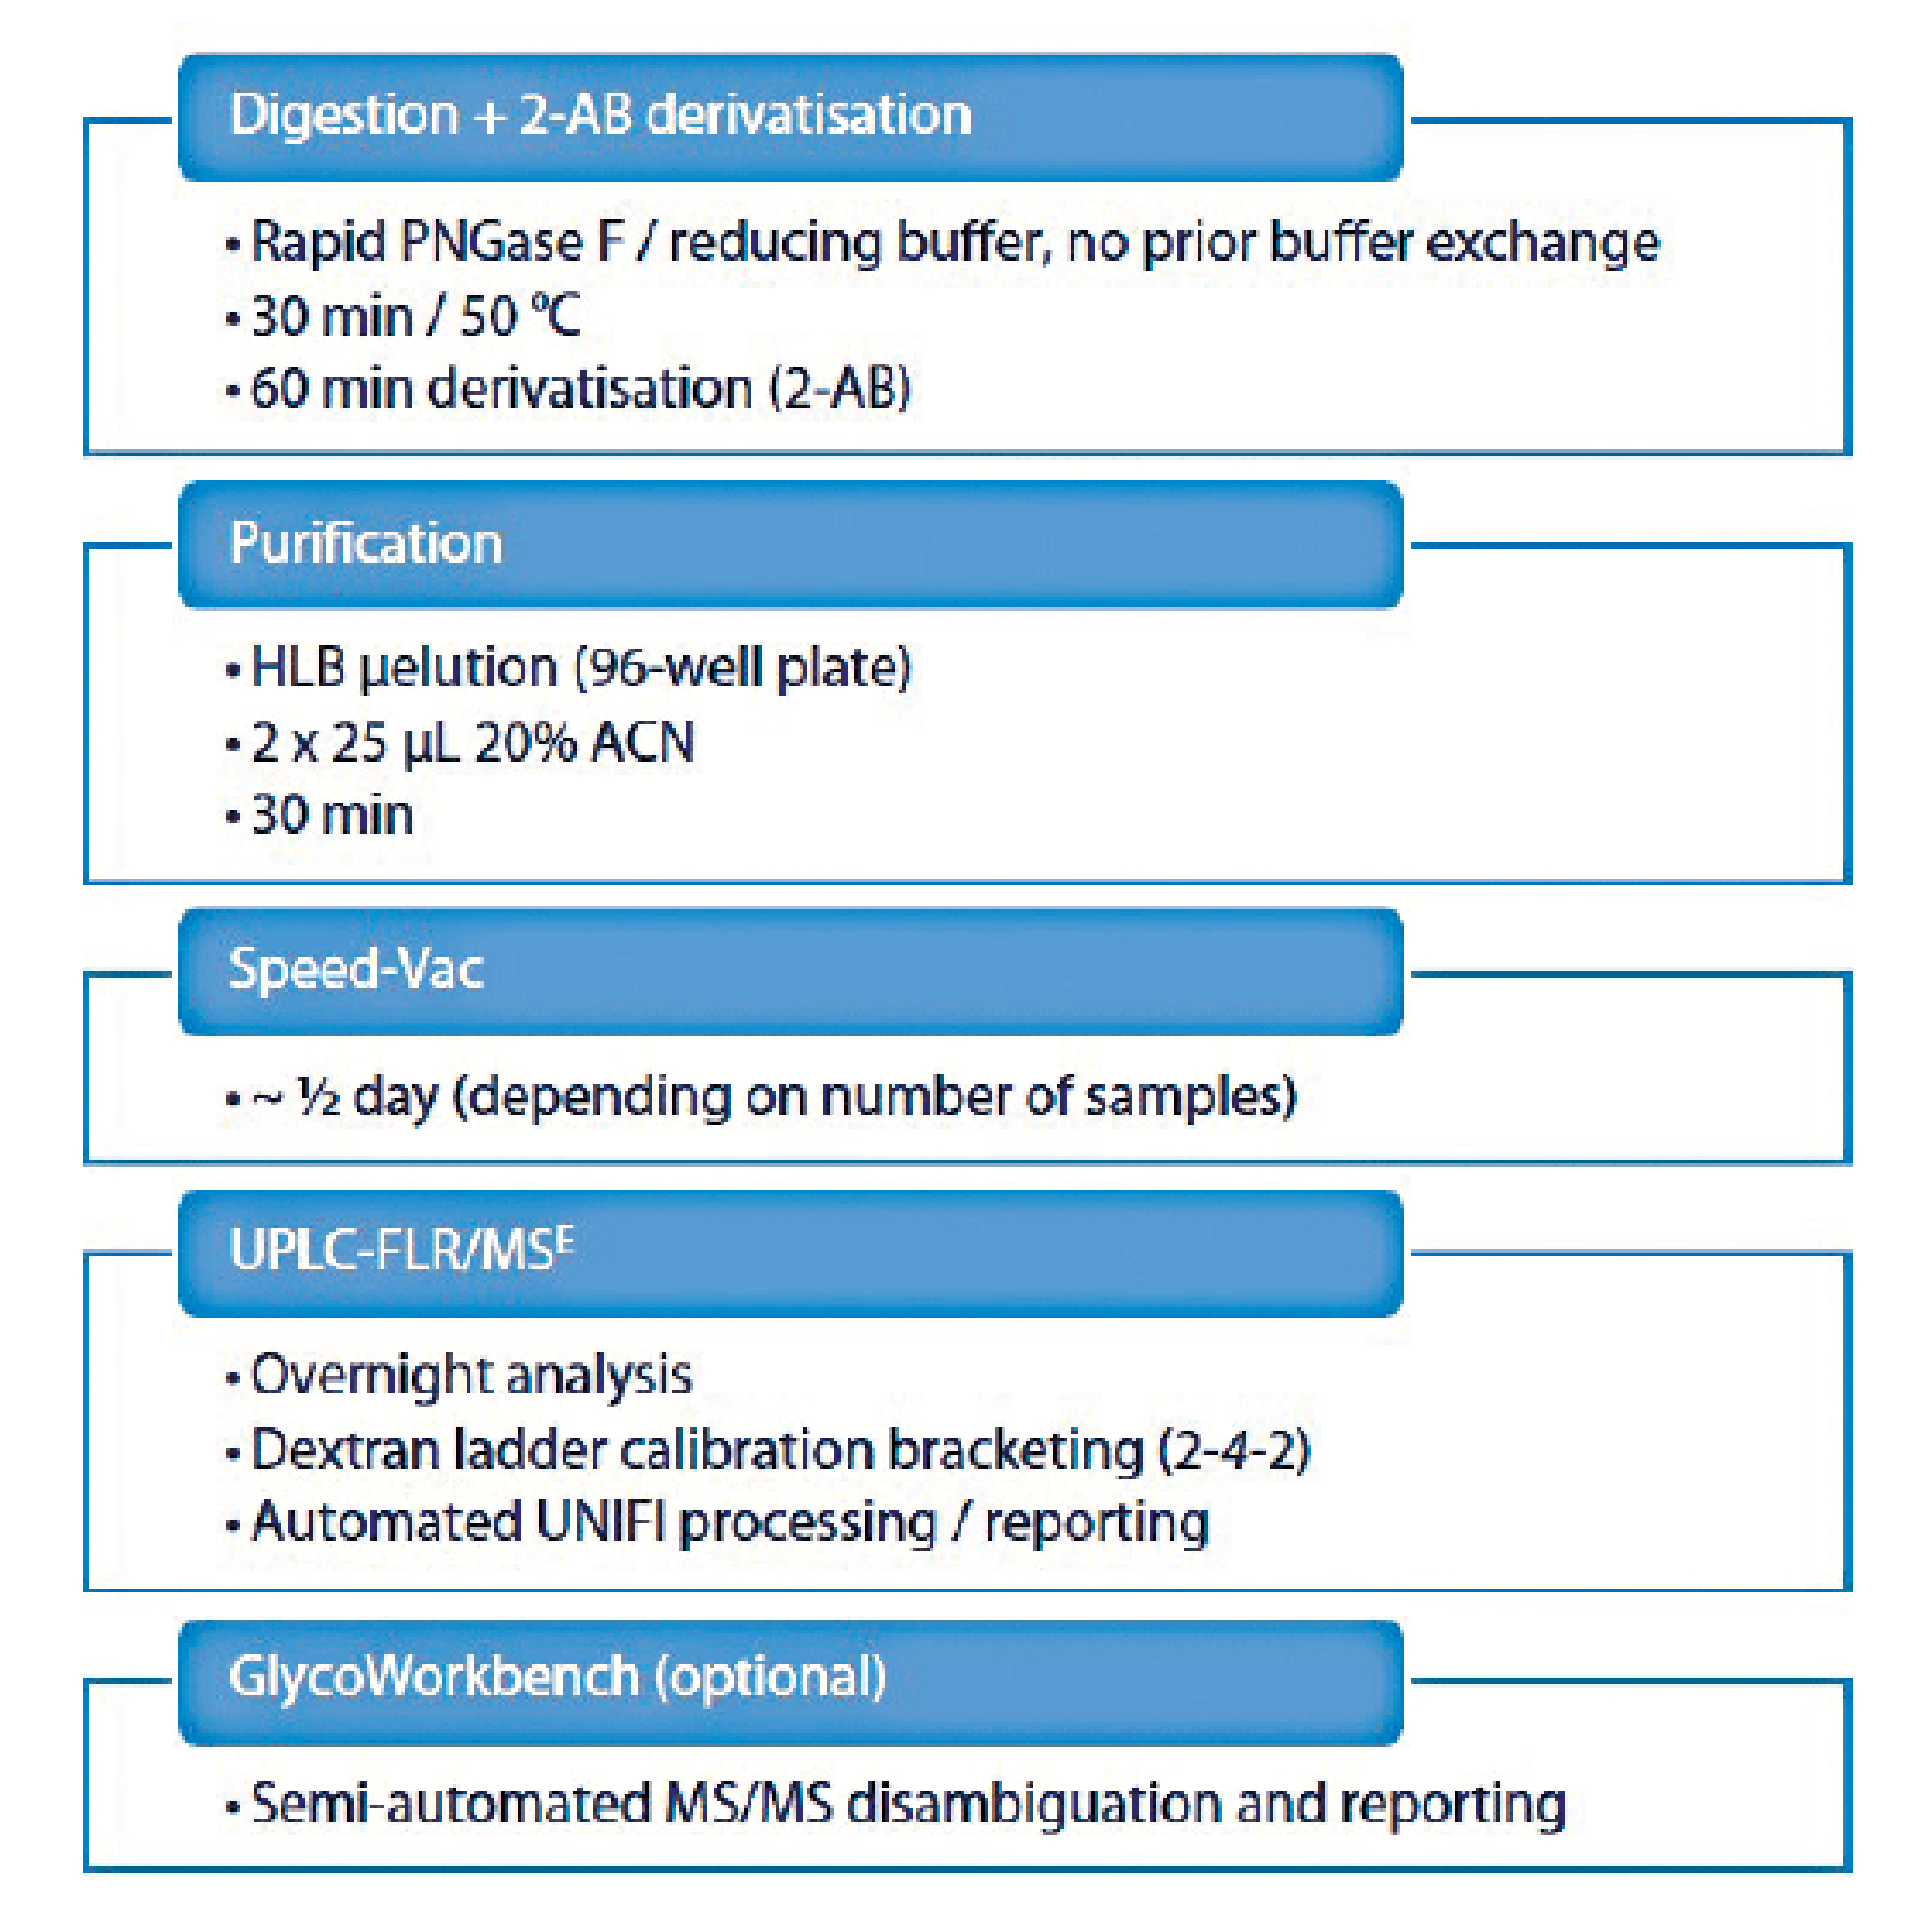
Figure 6: N-glycans profiling workflow
The UPLC/FLUO chromatogram obtained for Adalimumab is given in Figure 7.
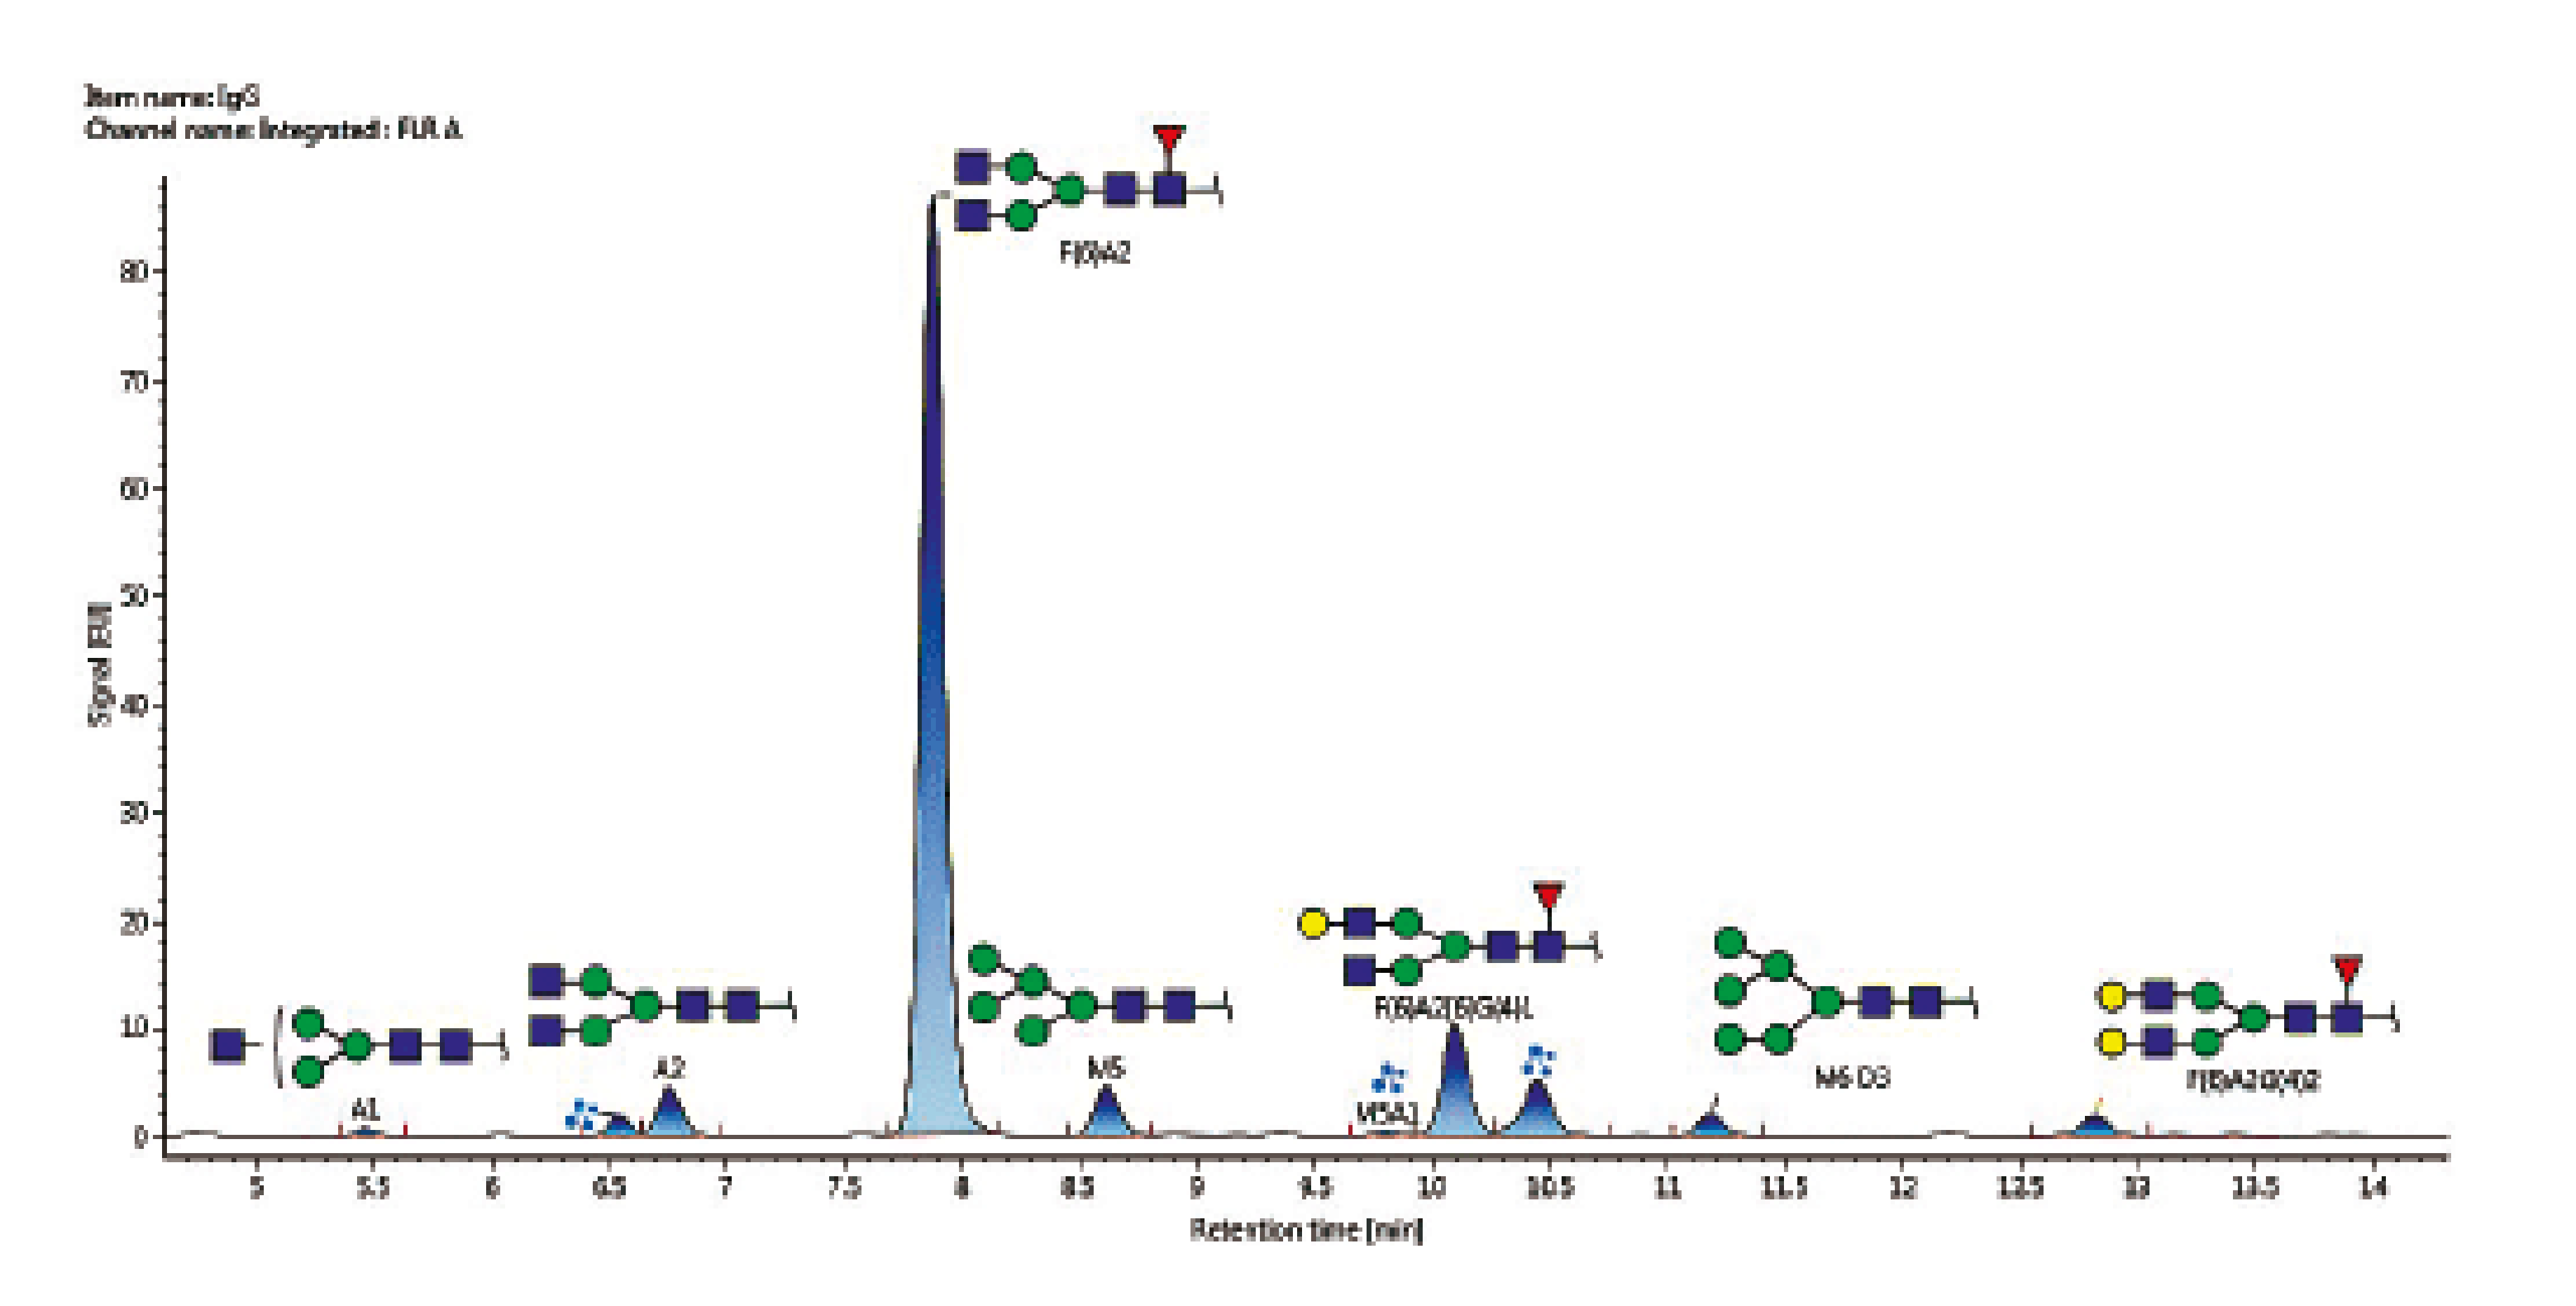
Figure 7: UPLC/FLUO chromatogram obtained for N-glycans profiling of Adalimumab
The main N-glycans detected (representing 95% of the total N-glucans oberved) are presented in Table 1.
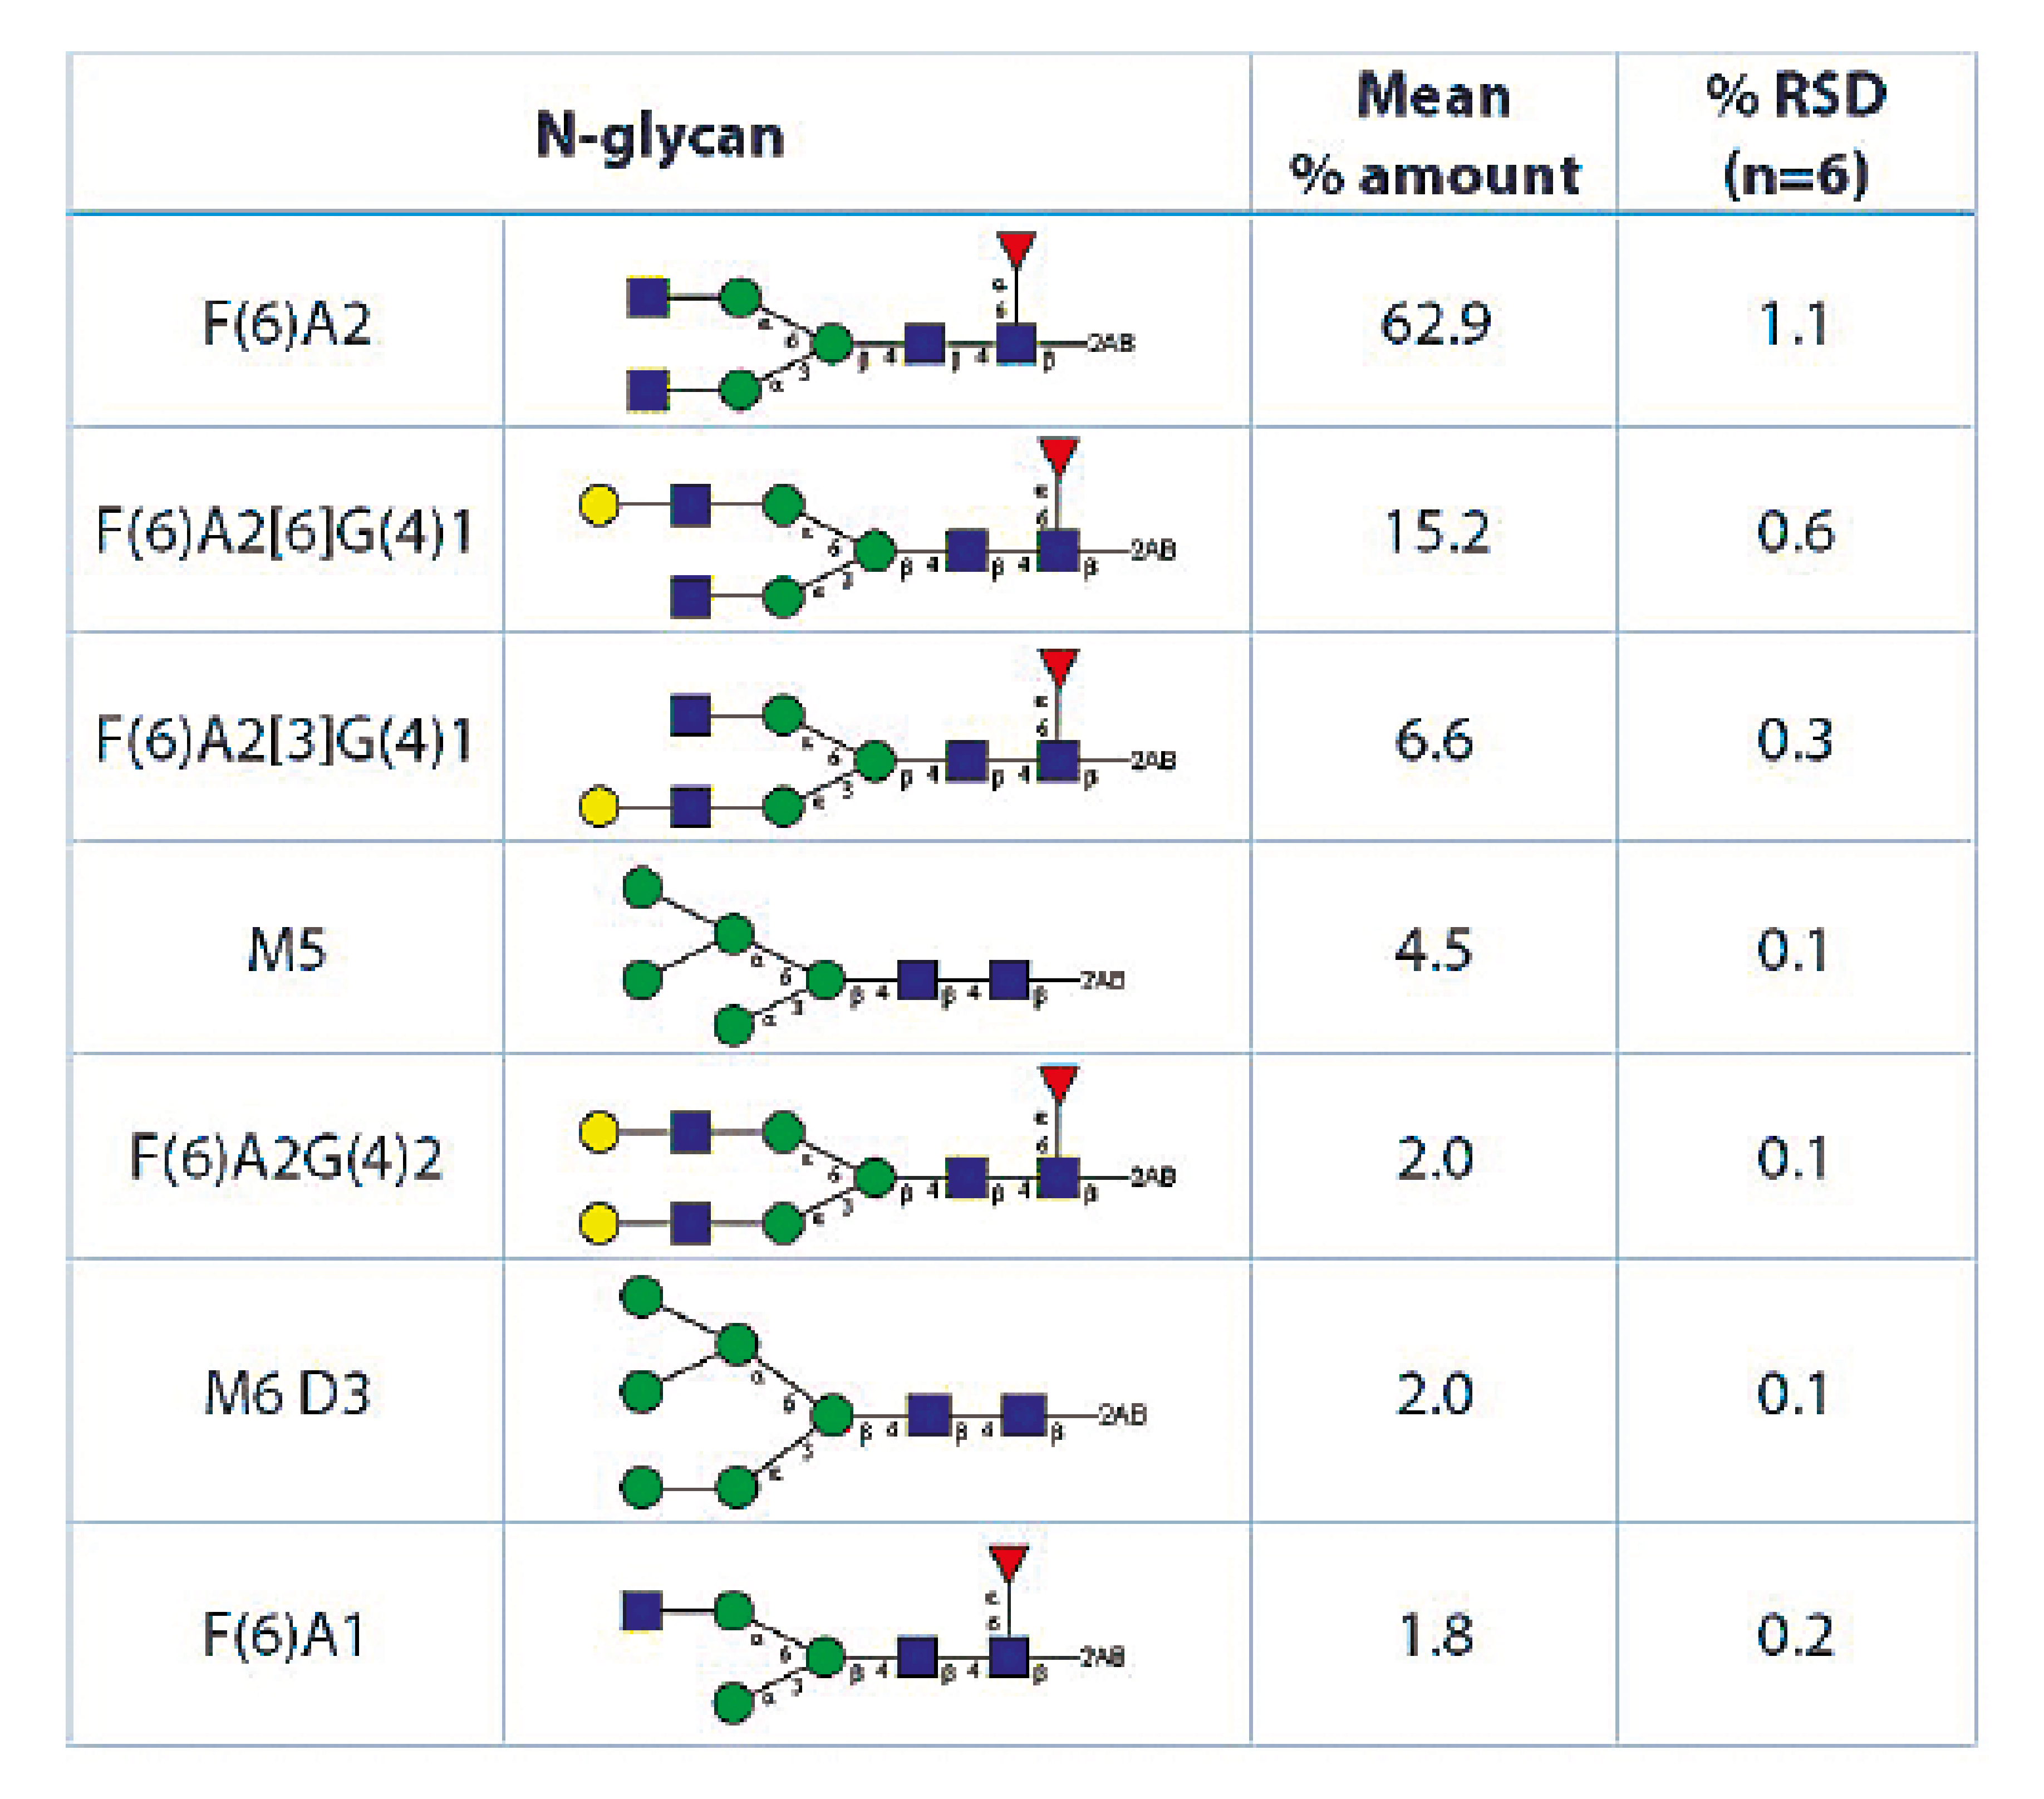
Table 1: Main N-glycans detected in an Adalimumab sample
Comparability studies performed to comply with the requirements of ICH Q5E after a change of a manufacturing process require the set-up of many orthogonal techniques. Mass spectrometry is a valuable tool as it can rapidly give very accurate information with limited amounts of sample. With only a few analyses, detailed information can be obtained on primary sequence and all post-translational modifications, including glycosylation.